Proptech Venture Capital Report — H1 2026

Proptech venture funding reached $4.53 billion across 231 funding rounds in H1 2026, with a median funding round of $6.75 million. Compared with the prior year, the market was broadly stable. H1 2026 funding was down 0.6% from H1 2025 and up 2.6% from H1 2024.
Those figures indicate stabilization, but not a broad-based rebound.
The first half of 2026 was defined by a sharp divide between headline funding totals and the underlying distribution of capital. A small number of large financings accounted for a significant share of market activity. H1 2026 included 11 funding rounds of $100 million or more, totaling $2.25 billion and representing 49.6% of all disclosed capital. By contrast, rounds below $5 million represented 75 disclosed transactions but only 2.8% of total funding.
The result is a market that appears stable in aggregate but uneven beneath the surface. Company formation remained active, particularly at the seed and pre-seed levels, while institutional-scale capital remained concentrated in fewer companies and categories.
This report does not conclude that proptech is in a boom market. It also does not support the view that the market is distressed. The data points to a more specific conclusion — proptech venture funding has settled into a lower, more selective post-2021 baseline.
The sectors attracting the most capital in H1 2026 were those tied to large structural needs in real estate — housing, construction, energy infrastructure, building operations, commercial real estate workflows, and capital markets infrastructure. At the same time, the funding mix shows that proptech is no longer solely a venture-backed software market. Debt, private equity, corporate capital, and other structured financings represented a meaningful share of total capital formation.
For venture investors, the implications are not uniform. The market remains active, but the data suggest that capital availability differs significantly by stage, asset class, business model, and capital structure. A seed-stage AI workflow company, a construction software platform, a housing finance business, and an energy infrastructure company may all fall within proptech and proptech adjacent, but they do not operate in the same funding market.
The state of proptech in H1 2026 is best understood as a market in transition — no longer supported by the speculative breadth of 2021 and 2022, but not in retreat. Capital remains available, but it is being allocated with greater concentration and more discipline.
H1 2026 Proptech Venture Capital Summary
The headline number shows stability. The distribution shows concentration.
The median round of $6.75 million is important because it provides a counterweight to the aggregate funding figure. A market can show several billion dollars of total capital, while the typical company raises a much smaller amount. That was the case in H1 2026.
The gap between total funding and median funding suggests that market conditions were not uniform. A limited number of large rounds had an outsized effect on the total, while many companies raised smaller rounds or disclosed no funding amount.
H1 Proptech Funding: 2021-2026
H1 2026 funding was down 0.6% from H1 2025 and up 2.6% from H1 2024. On a near-term basis, that suggests the market has stabilized.
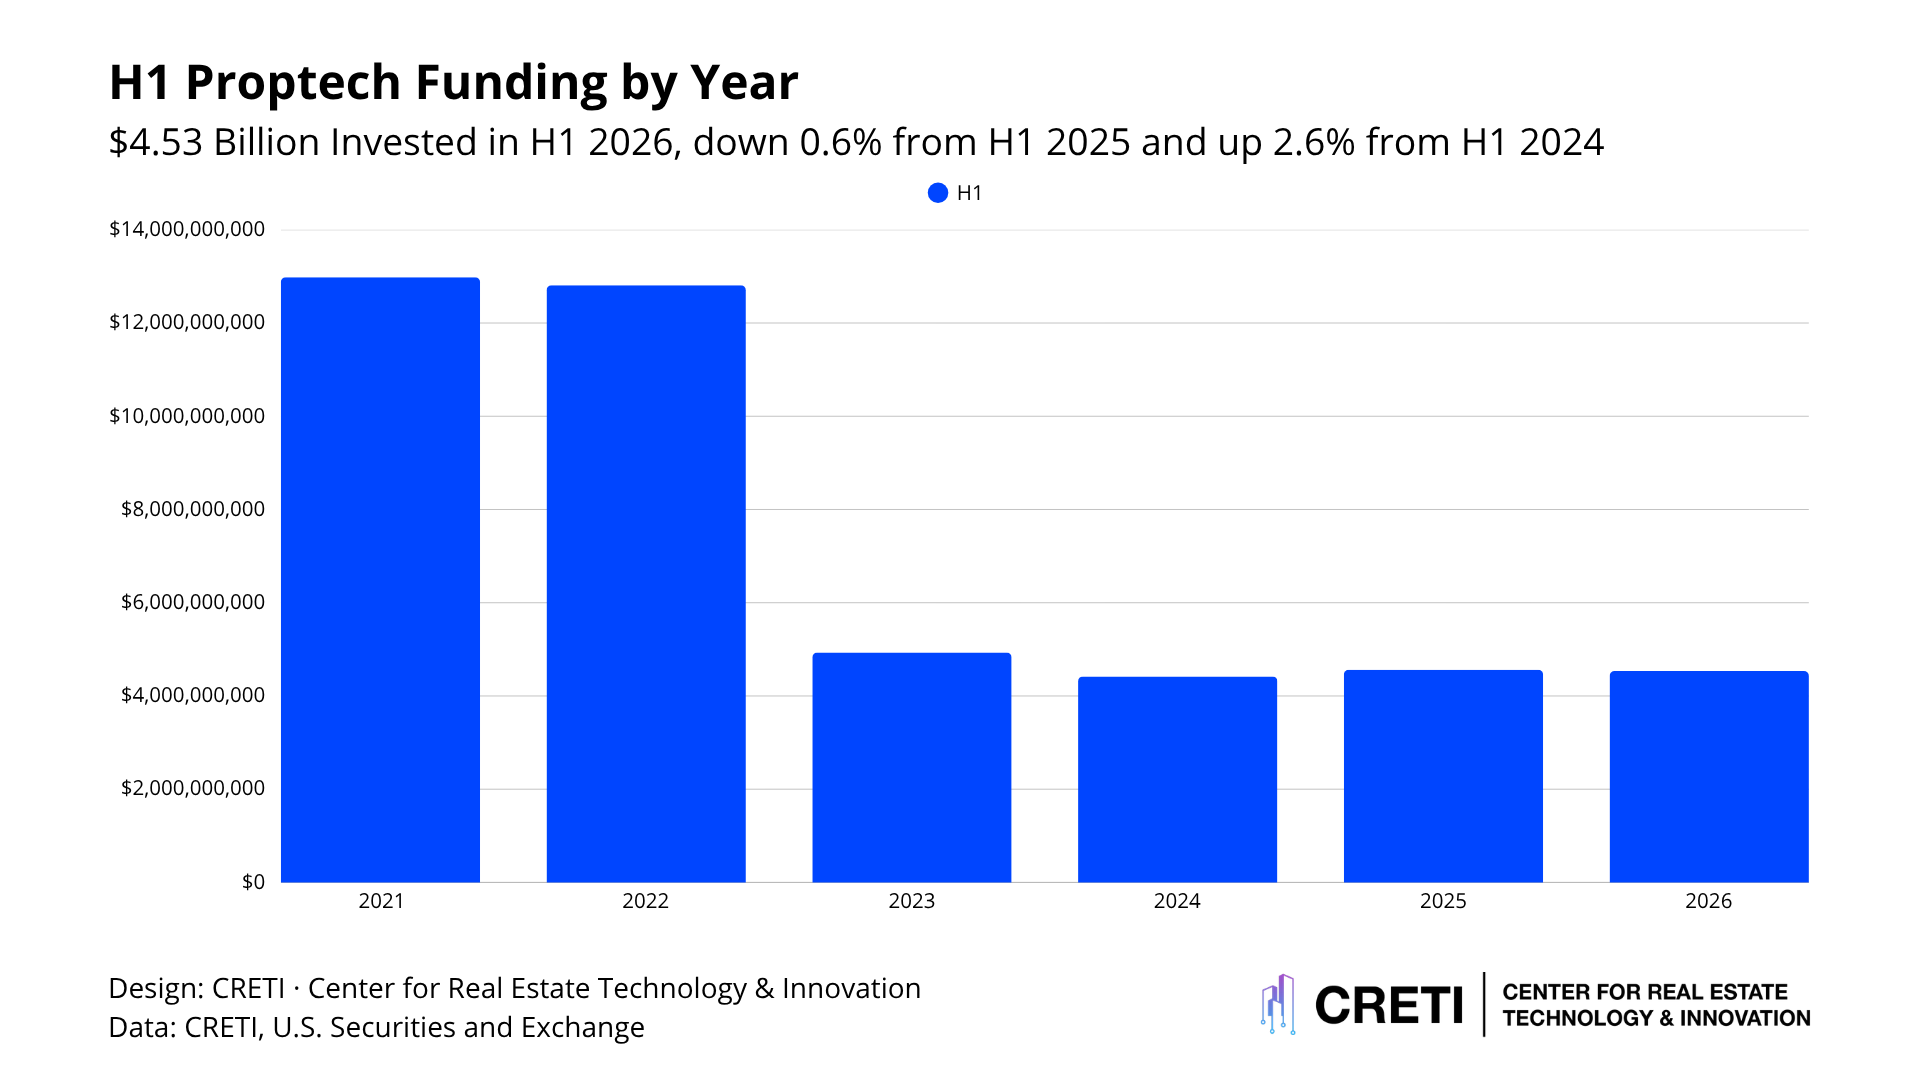
The longer-term comparison is different. H1 2026 funding remained approximately 65% below H1 2021 and H1 2022 levels.
The historical pattern shows that the industry has not returned to the funding environment of 2021 and 2022, often attributed to a dry-powder phenomenon from pandemic-induced investing. The reset that followed those years appears to have created a lower baseline for proptech funding. H1 2026 fits within that post-reset range rather than signaling a return to prior peak-cycle conditions.
A neutral interpretation is that the market has moved from correction to stabilization. The evidence does not yet support a conclusion of broad expansion.
Monthly Funding Analysis
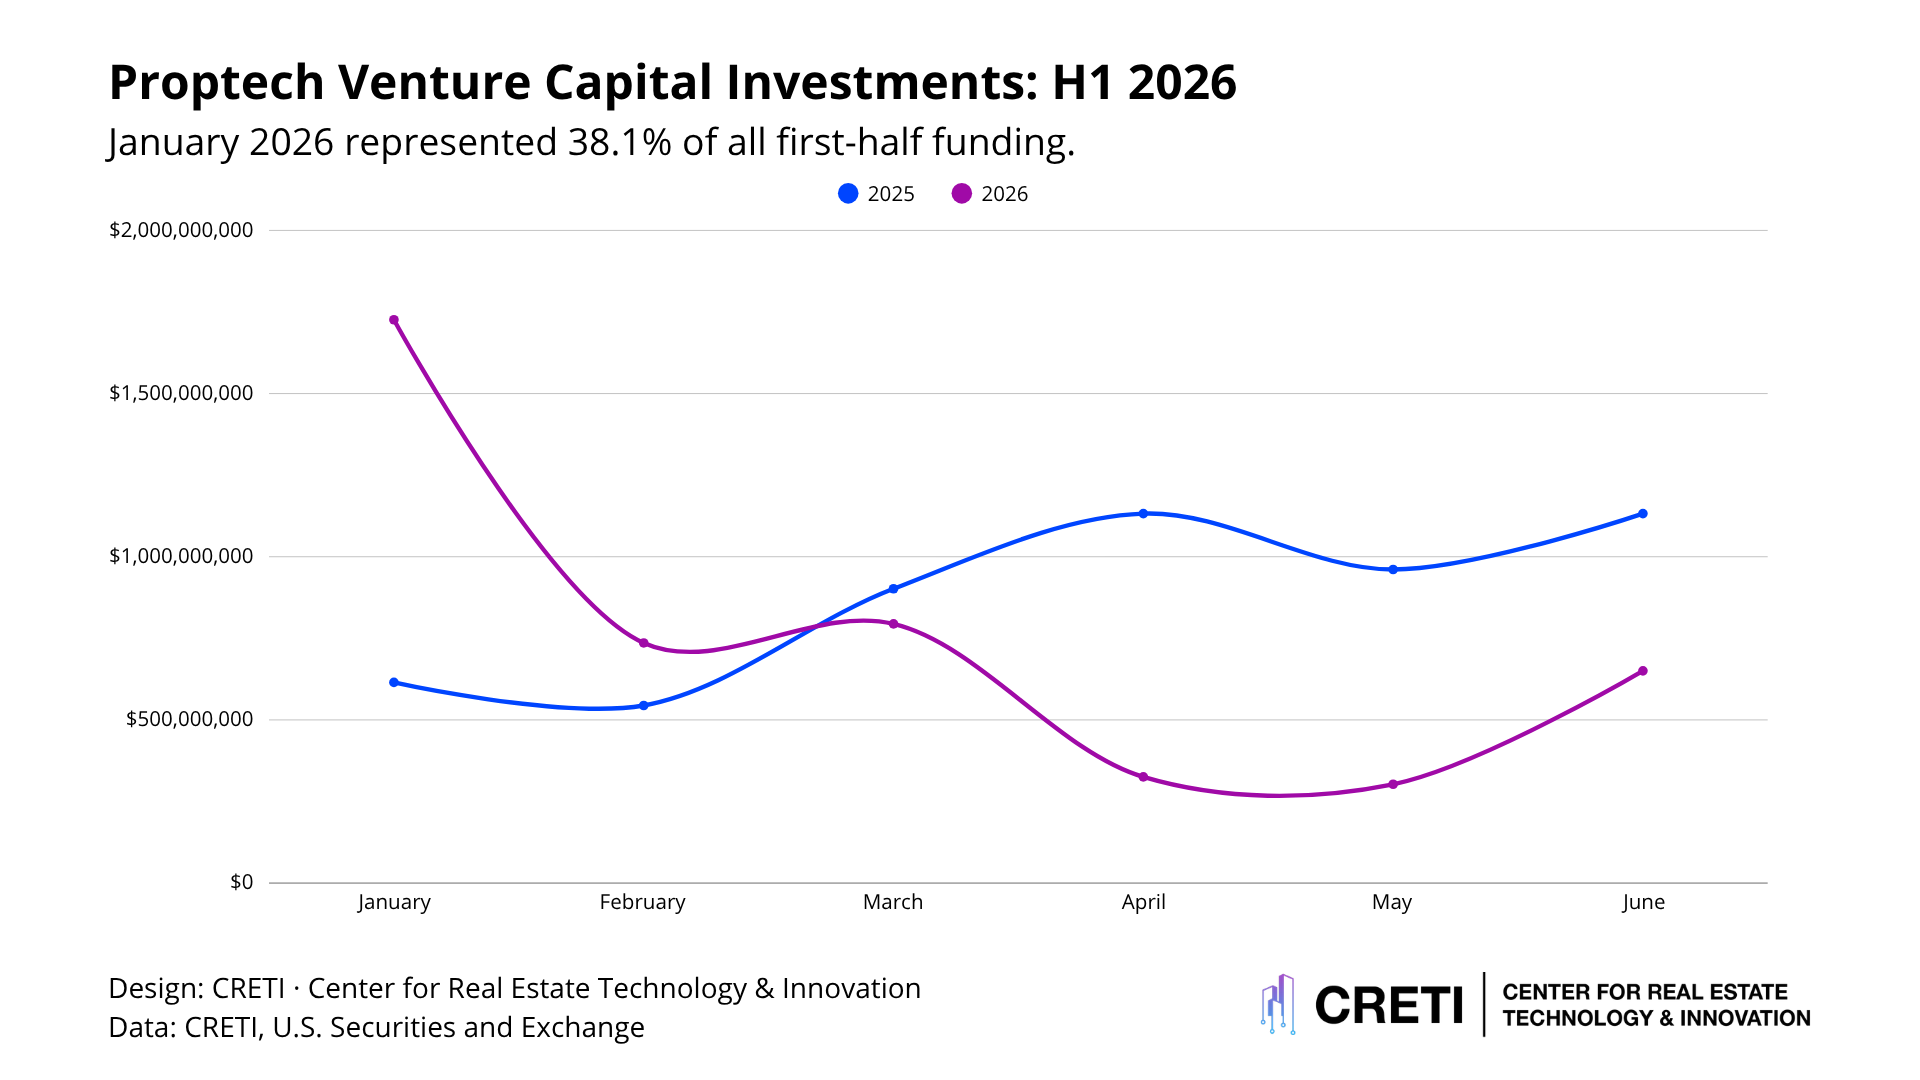
January was the largest month of H1 2026, with $1.73 billion of funding across 50 rounds. The month accounted for approximately 38.1% of all H1 funding.
April and May were the weakest months by dollar volume. April recorded $325.2 million, while May recorded $302.8 million.
June recovered to $650.4 million, supported by several larger investments, including the late addition of Higharc’s $95 million Series C. However, the June deal count declined to 29, down from 35 in May. That distinction matters. The rebound in June was driven by larger financings, not by an increase in the number of transactions.
The monthly data show a market in which the timing of large rounds materially affected the funding picture. Month-to-month changes should therefore be interpreted carefully.
The Distribution of Capital
The funding distribution shows a barbell pattern.
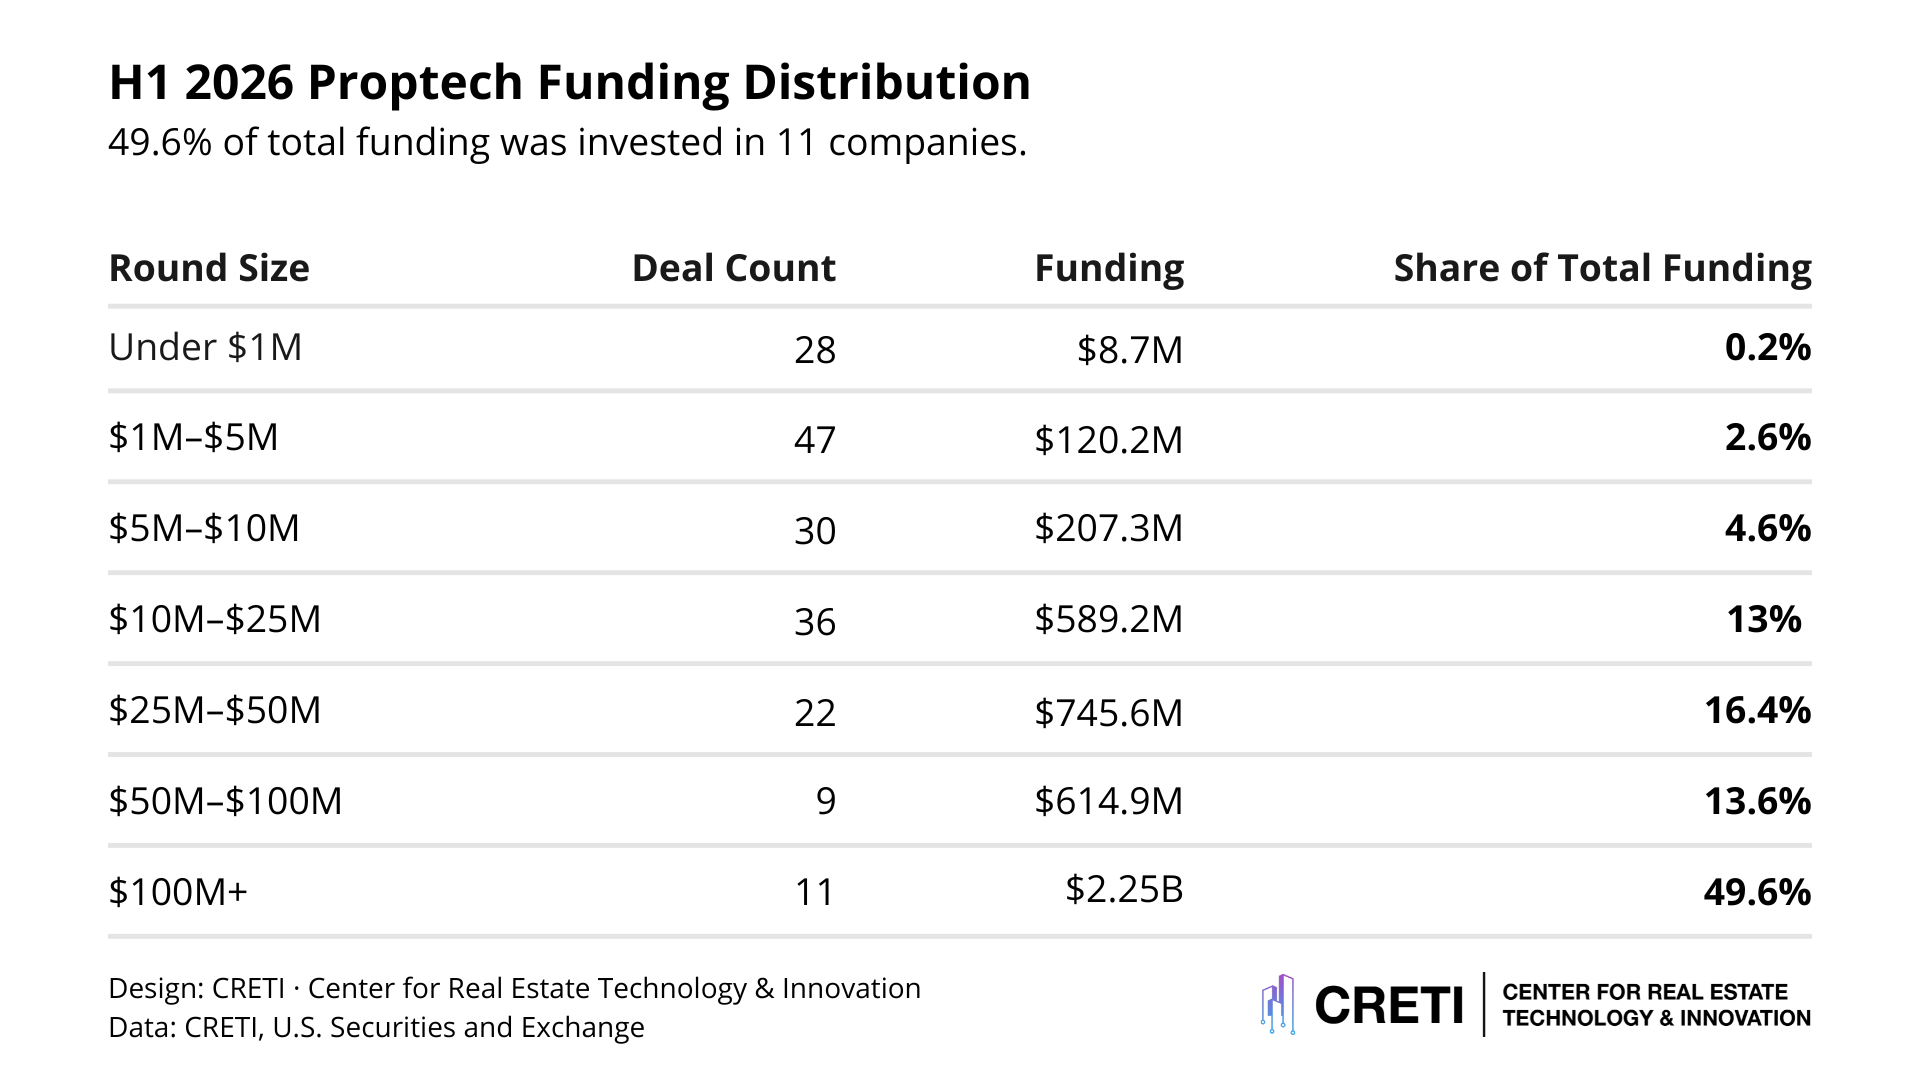
Rounds below $5 million accounted for 75 disclosed transactions but only 2.8% of total funding. Rounds above $100 million accounted for 11 transactions but 49.6% of total funding.
This pattern suggests that company formation and capital accumulation occurred in different parts of the market. Smaller rounds reflected continued startup activity. Larger rounds reflected capital concentration around companies that had reached greater scale, required more capital, or had access to structured financing.
The middle of the distribution is also important. Rounds between $10 million and $50 million accounted for 58 disclosed deals and approximately 29.4% of total funding. This is the portion of the market most closely associated with commercialization, scaling, and institutional venture underwriting. Its health is important for understanding whether early-stage companies are progressing into later stages.
The Largest H1 2026 Rounds
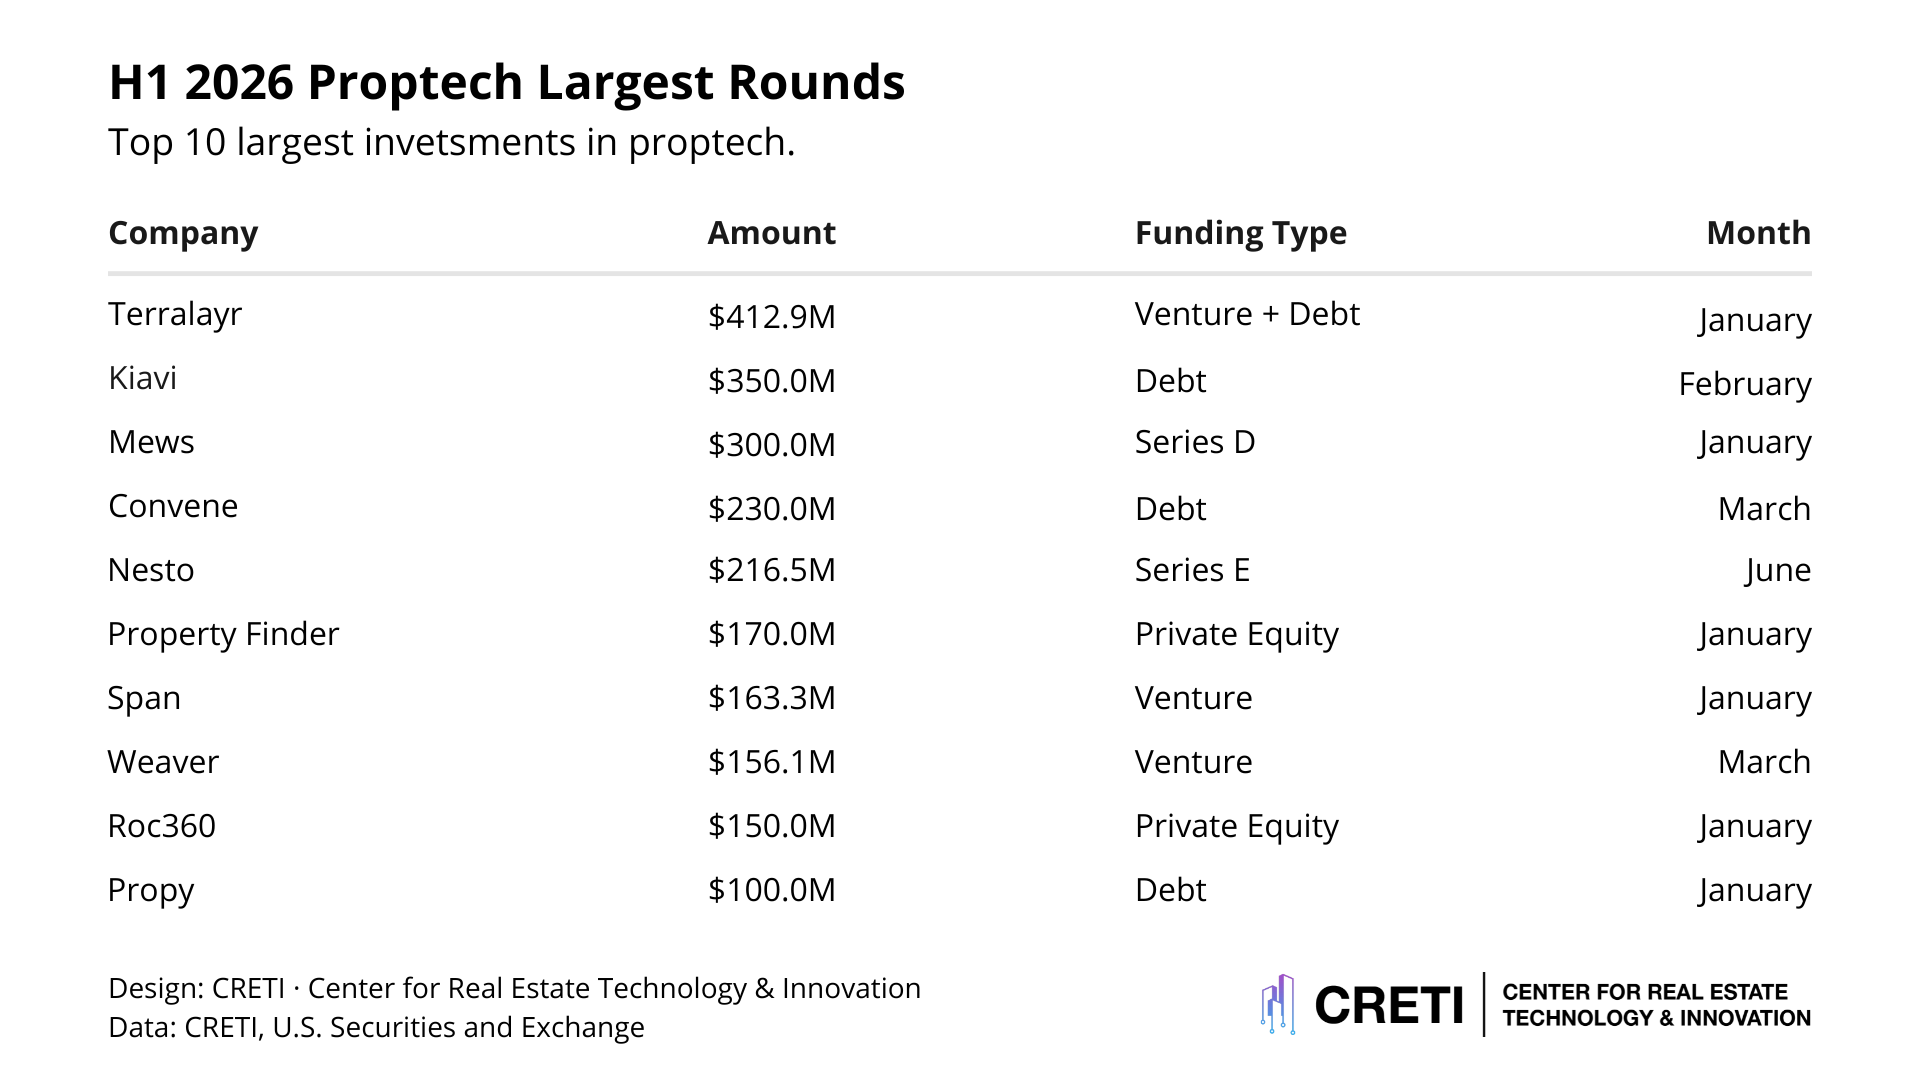
The concentration of nearly half of all capital in 11 rounds is one of the most important findings in the report.
This does not mean the broader market was inactive. It does mean that the aggregate funding figure was heavily influenced by a small number of large financings. Investors and readers should avoid interpreting the $4.53 billion total as evidence that capital was evenly available across the market.
The composition of the $100 million-plus group also matters. Several of the largest rounds were debt or private equity financings, not traditional venture equity rounds. That changes the interpretation of the funding environment. Large-dollar proptech capital formation increasingly includes structured capital and asset-linked financing, not only venture rounds.
Funding by Stage

Debt was the largest capital type in H1 2026, representing 27.7% of total funding. Private equity represented 10.4%. Together, debt and private equity accounted for approximately 38.1% of total disclosed capital.
That composition is significant. It indicates that proptech funding should not be read only through a venture-equity lens. A material share of capital went to companies or business models that can support debt, private equity, or other non-traditional venture structures.
This affects how the market should be interpreted. A period with large debt financings may show strong funding volume without necessarily indicating increased early-stage venture risk appetite. Similarly, private equity rounds may reflect company maturity or consolidation dynamics rather than venture-style company formation.
What This Means for Proptech
Proptech funding in H1 2026 was stable, with periods of unevenness for proptech venture funding.
The market raised $4.53 billion across 231 rounds, placing it roughly in line with H1 2025 and modestly ahead of H1 2024. That suggests stabilization after the sharp reset from the 2021 and 2022 peaks.
At the same time, the composition of funding shows a concentrated market. Eleven rounds of $100 million or more accounted for 49.6% of all capital. Early-stage rounds remained active by count but represented a much smaller share of dollars. Debt and private equity were significant components of total funding.
The most accurate reading is not that proptech is broadly accelerating or broadly weakening. The data show a market that has become more selective.
Capital continues to flow into real estate technology, but it is not distributed evenly across companies, stages, or categories. Larger financings are concentrated around scaled companies, structured capital recipients, and categories connected to housing, construction, building infrastructure, energy, and operational efficiency.
For investors evaluating the state of the market, the central lesson is methodological as much as financial — headline funding totals are not enough. In H1 2026, understanding proptech required looking beneath the aggregate number to examine concentration, stage mix, capital type, deal size, and asset-class exposure.
That is where the market story becomes clearer.
Proptech funding has stabilized. The market has not broadened.